Creating a Bar Graph
WALT: Construct suitable data displays, with and without the use of digital technologies, from given or collected data.
WILF: I can collect data in a table.
I can create a simple bar graph with titles and labels
A bar graph can be used to show information about all sorts of topics. Watch the simple video about creating a graph, then complete the activities set for you in StudyLadder. Once you are ready, you can complete a survey to create your own graph. Use the links below to download the worksheet you would like to use.
Symmetry in the Environment
WALT: Create symmetrical patterns, pictures and shapes with and without digital technologies
WILF: I can create a picture that is the same on both sides.
WILF: I can create a picture that is the same on both sides.

|
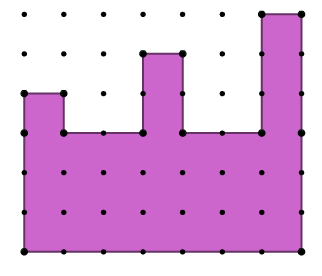
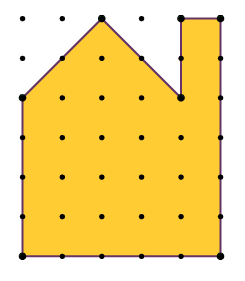
Can you work out the area of these shapes
Draw these shapes into your workbook.
See if you can work out the area of the two shapes.
See if you can work out the area of the two shapes.
|
|